

Overview
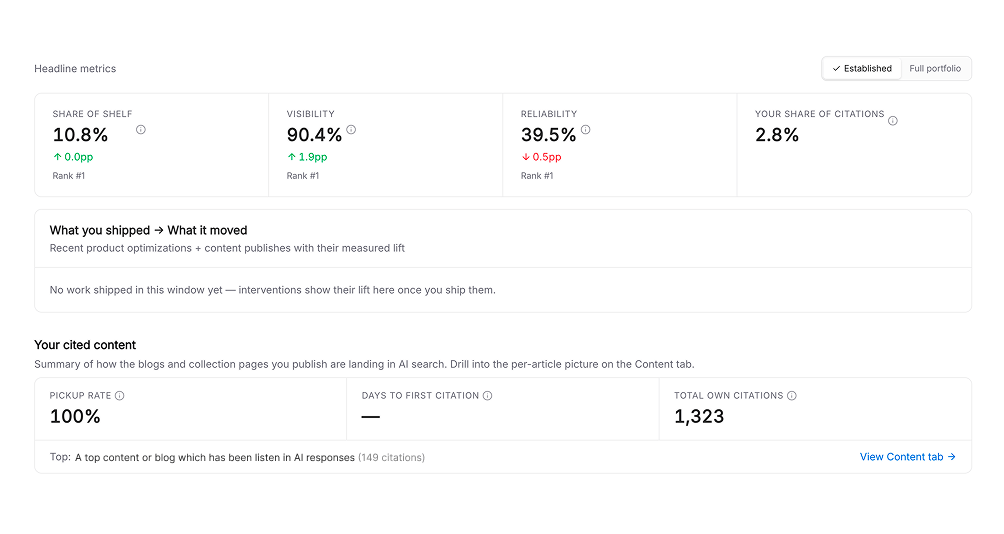
The dashboard is your starting point each time you log in. It summarizes how your products are showing up in AI shopping answers, surfaces the content AI is already citing, and flags data worth cleaning up, each with a change versus the previous period.Headline metrics
For precise definitions, see What is Share of Shelf?.
Cited content
The dashboard highlights your own pages that AI shopping engines have recently cited, a quick read on which content is earning its place on the shelf. Dig deeper on the Citations page.Data quality
Siftly flags items it couldn’t confidently match: products or brands seen in AI answers that don’t line up with your catalog. Resolving these keeps your metrics accurate. Each item links into Conversations so you can see the context.If you’ve just onboarded, some cards will be empty until your first analysis completes. Newly tracked products also spend their first 14 days in a warm-up cohort before counting toward headline Share of Shelf.
Where to go next
Visibility & Share of Shelf
Track shelf share and competitive position over time.
Citations
See which sources AI engines cite in your market.
Products & readiness
Find untapped products to prioritize.
Conversations
Read the prompts and responses behind your metrics.