

Overview
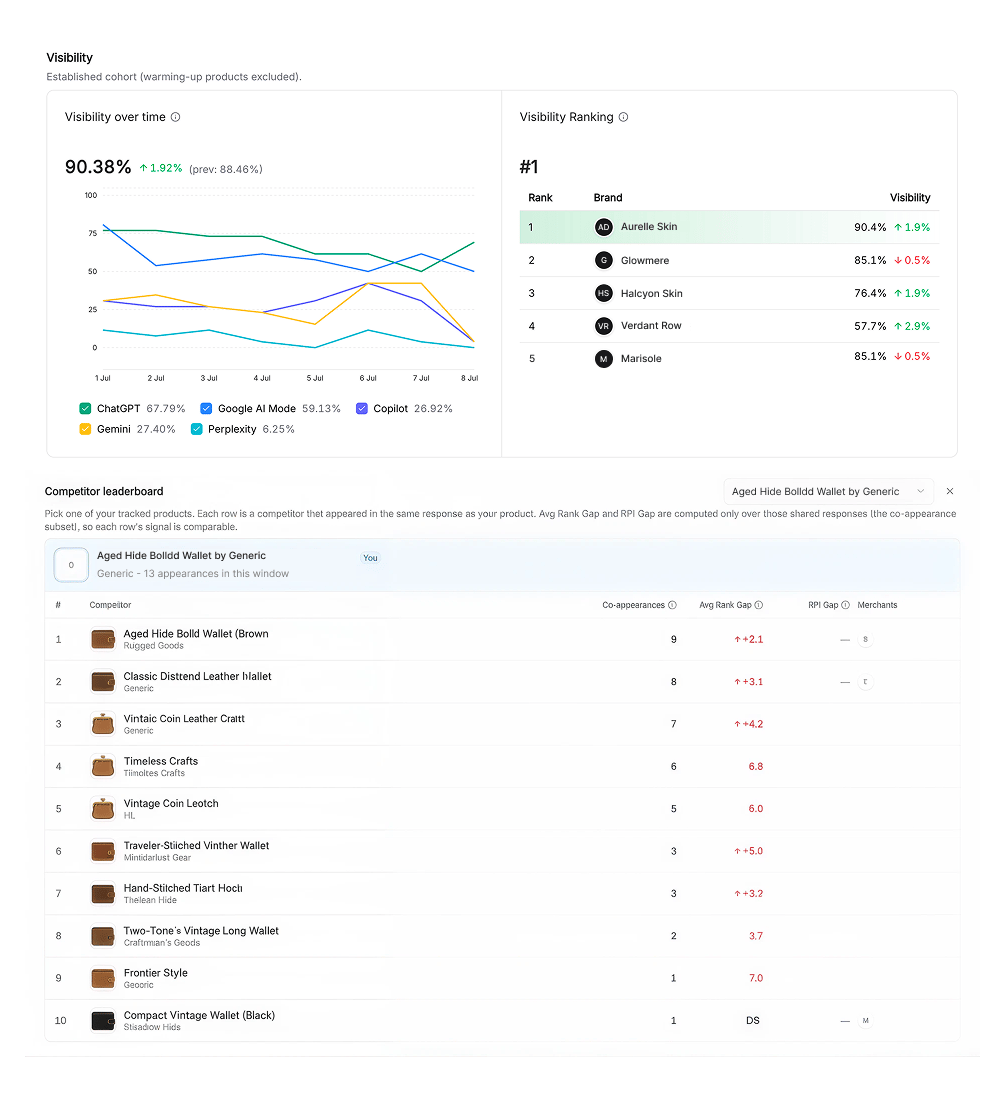
The Visibility page is where you track Share of Shelf (the share of product tiles in AI shopping answers that are yours) and how it moves as you publish content and optimize products. It’s your main view of competitive standing on the AI shelf. New to the metric? Start with What is Share of Shelf?.The Share of Shelf trend
The headline chart plots your Share of Shelf over time, with intervention markers showing when you published a blog post, a Collection Page, or a product optimization, so you can see the lift each change drove.- Cohort toggle: switch between mature (established products only) and full portfolio (including products still in their 14-day warm-up).
- Geography filter: scope every metric on the page to a specific country.
Brand and product visibility
Alongside Share of Shelf, the page tracks:- Visibility: the breadth of shopping intents where your brand appears at all
- Reliability: how consistently you appear when the same prompt is asked repeatedly
- Brand vs. product mentions: whether your brand showed up, and which specific products did
Competitive view
- Competitor leaderboard: your Share of Shelf plotted against the top brands on your shelf
- Heatmap: shelf share across brands by geography or by product, so you can spot strengths and gaps at a glance
Per-product drill-down
A table breaks visibility down by product (visibility, reliability, Share of Shelf, and rank) so you can see which products carry your shelf presence and which need work. Click a product to open its readiness detail. See Products & readiness.Related
Commerce Control
Go beyond presence to pricing and buy-button control.
Conversations
See the prompts behind your shelf share.
Products & readiness
Drill into per-product readiness.
Content & optimization
Turn shelf gaps into published improvements.